Our bio lab is quite noisy because of a 24-7 working ventilation duct on the ceiling - the room needs to be kept under negative pressure. At some point the noise reached 80 dB, which is quite annoying.
So here I am, trying to use my knowledge from environmental physics lessons to track the source of noise pollution.
The noise in our bio lab is supposed to be the result of some structures causing standing waves as the ventilation system drives air through the room and into the duct. So the key to solve that noise pollution would be to find the most powerful standing waves, and alter related structures. Once these structures are altered, hopefully we won’t have any annoying standing waves.
Sampling
To track standing waves we need some noise samples. However, we don’t have a proper device to record the noise, and the only thing available at had was my smartphone. Microphones in smartphones are good at recording human voice, but I’m not confident at their ability to record low-frequency noises. Sampling accuracy may be influenced by microphone sensitivity and other systematic bias caused by the smartphone structure.
So I found a way to (partly) compensate for this unreliability. I used 3 smartphones of different brands (vivo, Honor and iPhone), 2 of which borrowed from my colleagues Marcel & Lin Wei. I recorded 3 pieces of noise samples, each lasting for roughly 15 seconds (sample_A.m4a, sample_B.m4a, sample_C.m4a). sample_A.m4a and sample_B.m4a both had 2 channels, while sample_C.m4a had a single channel. The sampling rates were all 48000 Hz.
Fourier transform
In order to find dominant frequencies, I used MATLAB to do Fourier transform. Sample sections (from the 4th second to the 12th second) were used to avoid disturbance at the beginning and end of noise records.
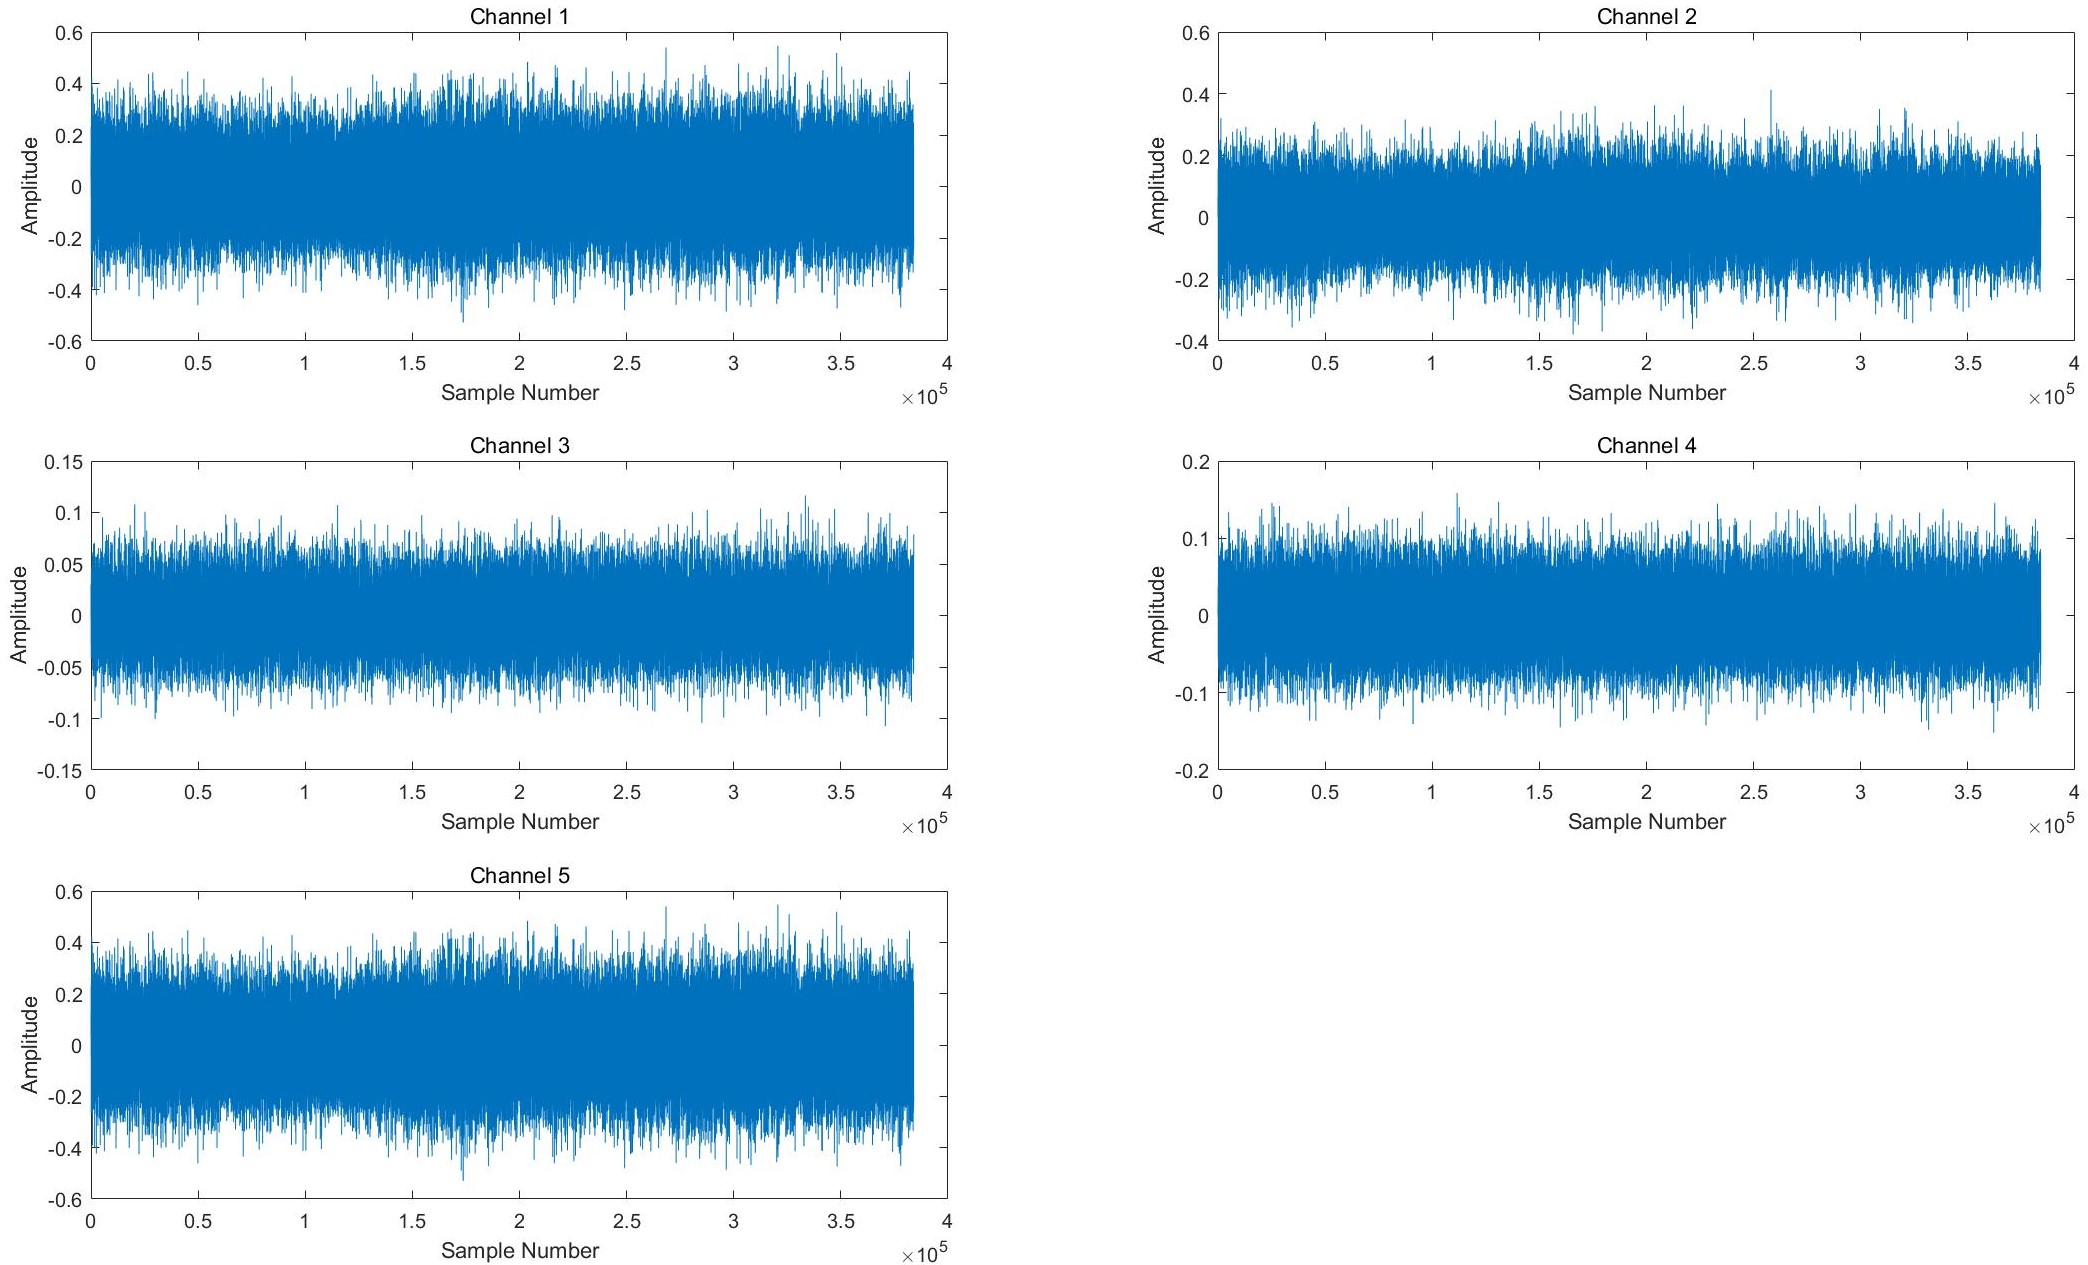
Channel 1-2: Honor; Channel 3-4: vivo; Channel 5: iPhone.
Then I used fft() function to do fast Fourier transform for these 5 channels. It’s clear that the 3 phones showed very different performance in recording noise samples. Channel 1-2 (Hornor) showed a high peak at 320 Hz, and one of its channel had a second peak at 95 Hz. Channel 3-4 (vivo) had their 1st peak at 97 Hz, and 2nd peak at 37 Hz. Channel 5 (iPhone) peaked at 48 Hz.
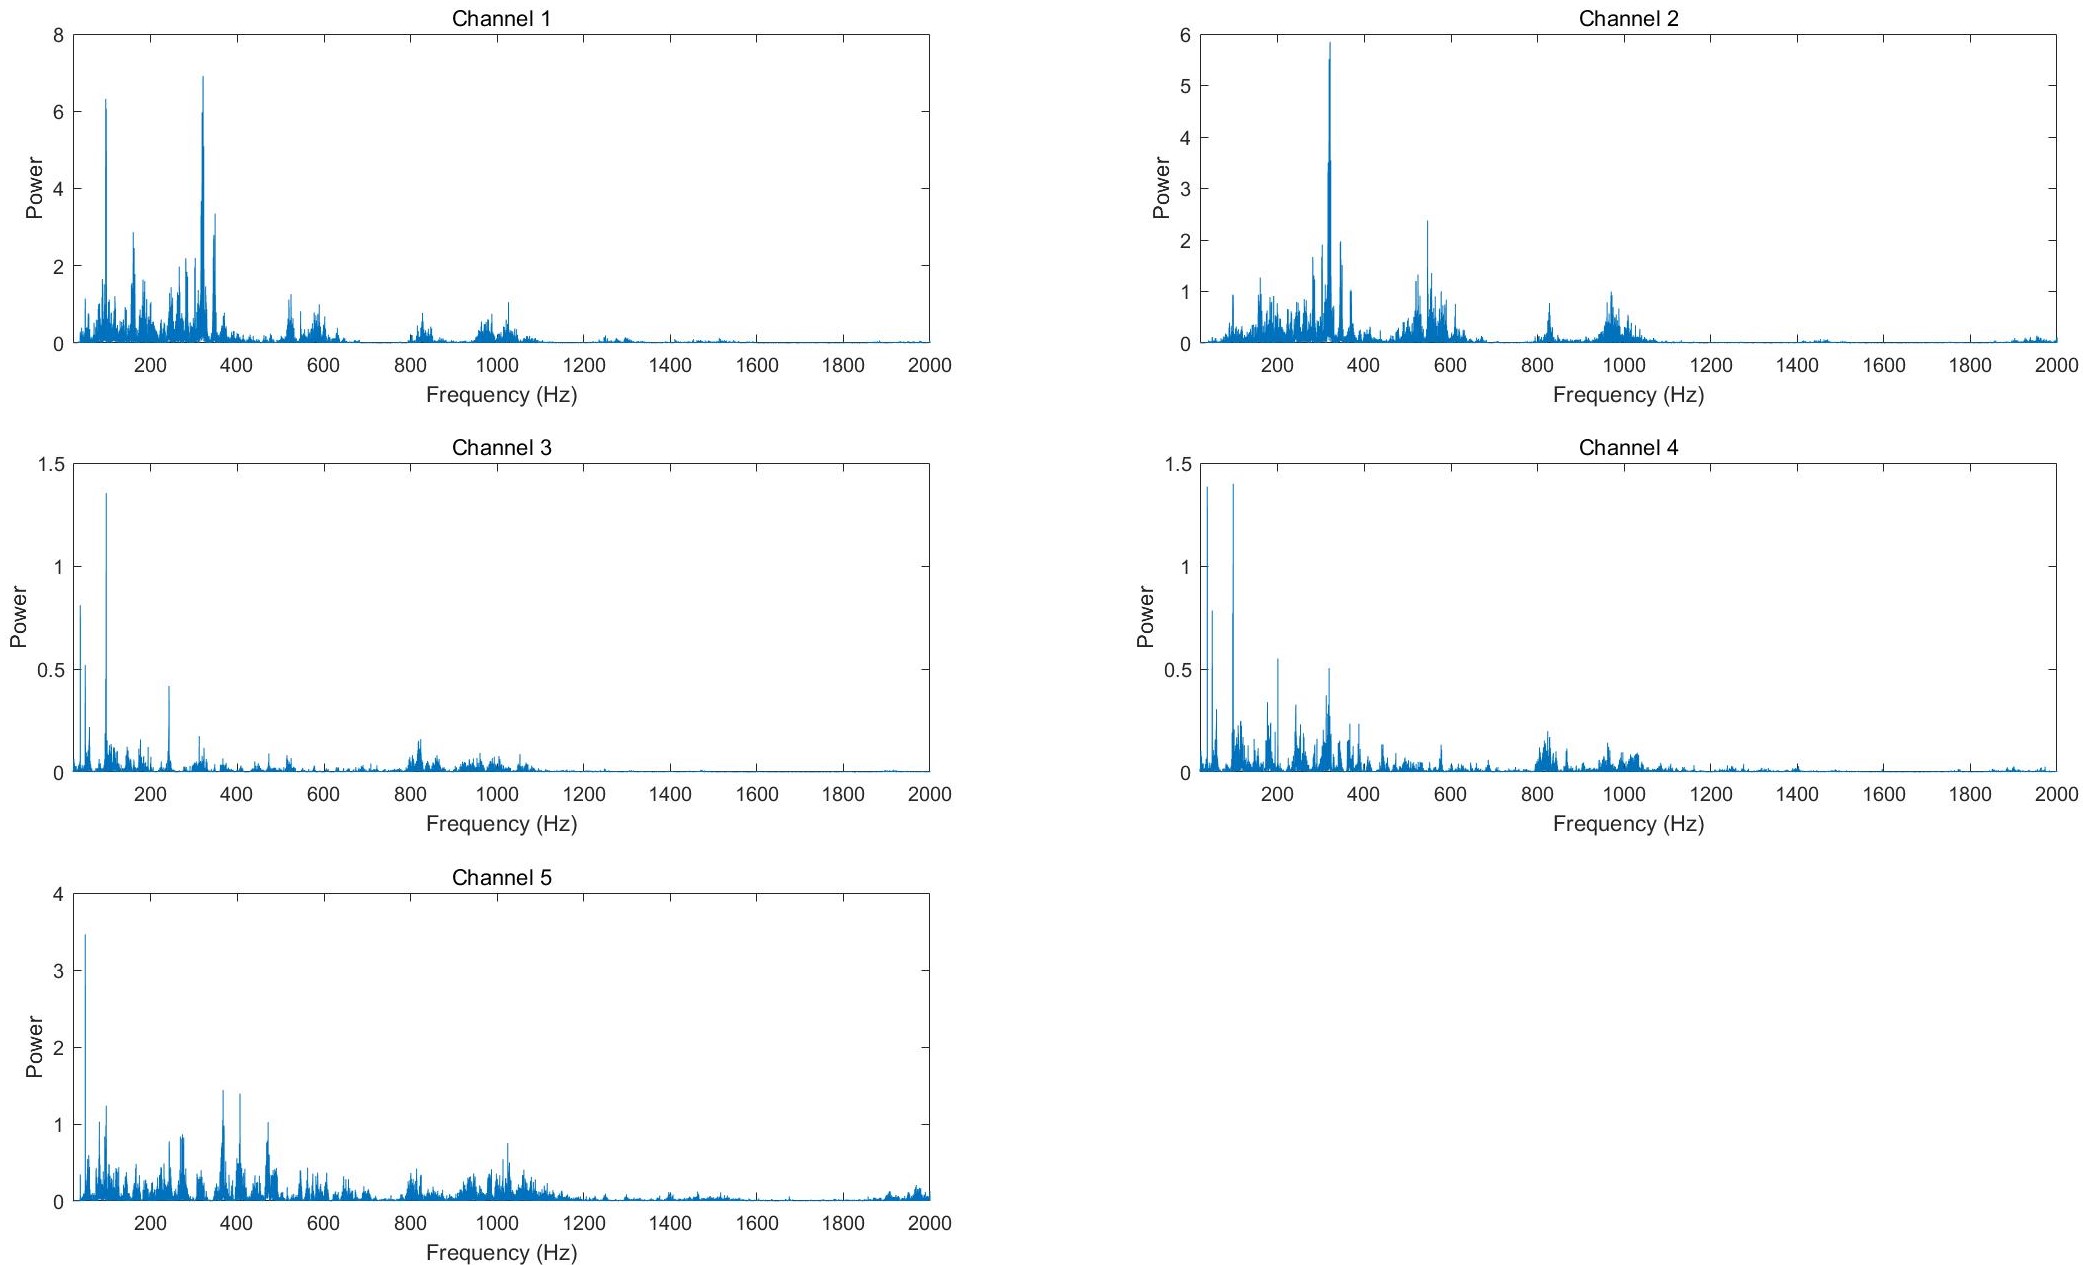
Channel 1-2: Honor; Channel 3-4: vivo; Channel 5: iPhone.
The results were quite a bit mess, but to some degree that’s exactly what I had expected. Some of the peaks make a lot of sense, e.g., the 97/95 Hz peaks indicate a wavelenght of 3.5 m, which is exactly the width of our bio lab - so this is a standing wave with its nodes attached to 2 opposite walls of the room.
Conclusion
It’s fairly simple to remove that standing wave - just put some sound-absorbing cotton on related walls and it will be gone. But it’s also not so simple since we have to make sure that these sound-absorbing cotton will not bring other risks to our bio lab, e.g., undesired volatile chemicals or fire-proof/safety standards that are not met. Another pretty simple way is to lower the power of ventilation and thus the energy of vibration will also drop to an acceptable level, hopefully. Let’s wait and see what people from construction/decoration departments would suggest.
Meanwhile, we’ve learned from this experience that it is never recommended to analyze frequency spectrums with smartphones - professional vibration meters are expensive for a good reason.