 1
 2
 3
 4
 5
 6
 7
 8
 9
10
11
12
13
14
15
16
17
18
19
20
21
22
23
24
25
26
27
28
29
30
31
32
33
34
35
36
37
38
39
40
41
42
43
|
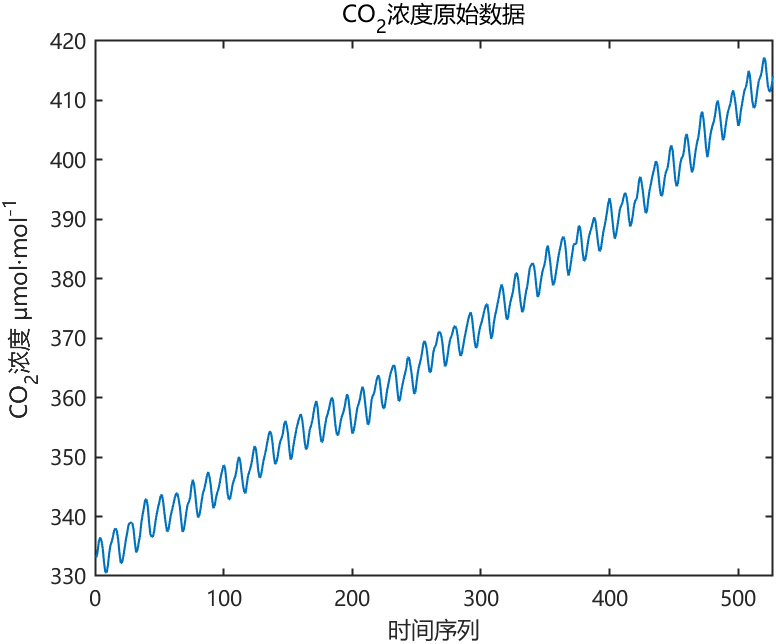
Data = xlsread('历年CO2数据.xlsx'); % 读入数据

Y0 = Data(25:length(Data),3); % 前7年数据有缺失,从976年开始逐月连续。前两列是年-月,第三列数据是CO2浓度
figure(1)
plot(Y0); xlim([0,527]);
ylabel('CO_2浓度 μmol·mol^{-1}'); xlabel('时间序列'); title('CO_2浓度原始数据');

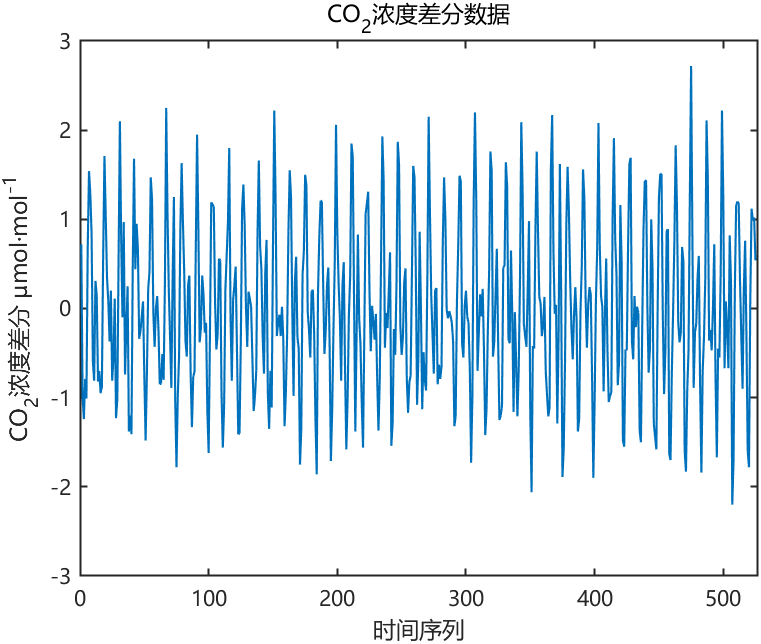
n = 2; % 差分阶数
Y = Y0;
for i = 1:n
	Y = diff(Y);
end

y_h_adf = adftest(Y) % ADF检验
y_h_kpss = kpsstest(Y) % KPSS检验

figure(2)
plot(Y); xlim([0,527]);
ylabel('CO_2浓度差分 μmol·mol^{-1}'); xlabel('时间序列'); title('CO_2浓度差分数
据');

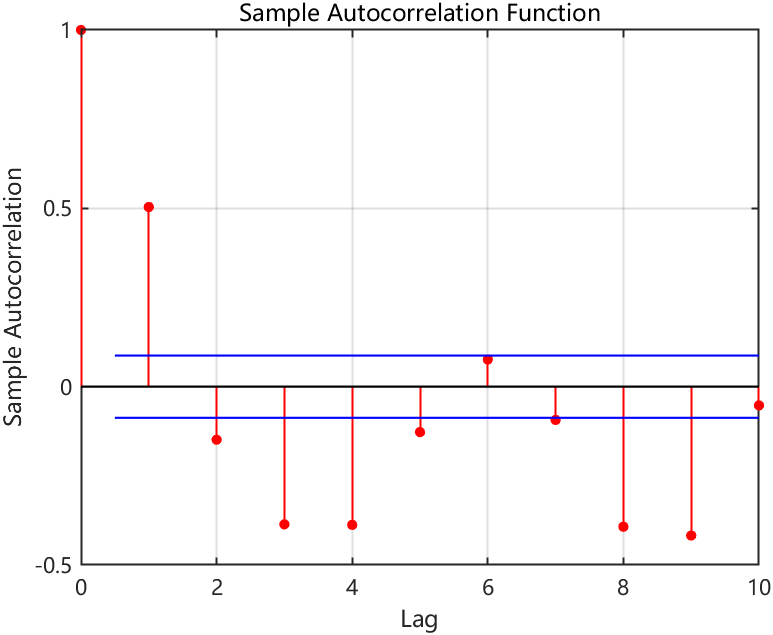
figure(3)
autocorr(Y,10);
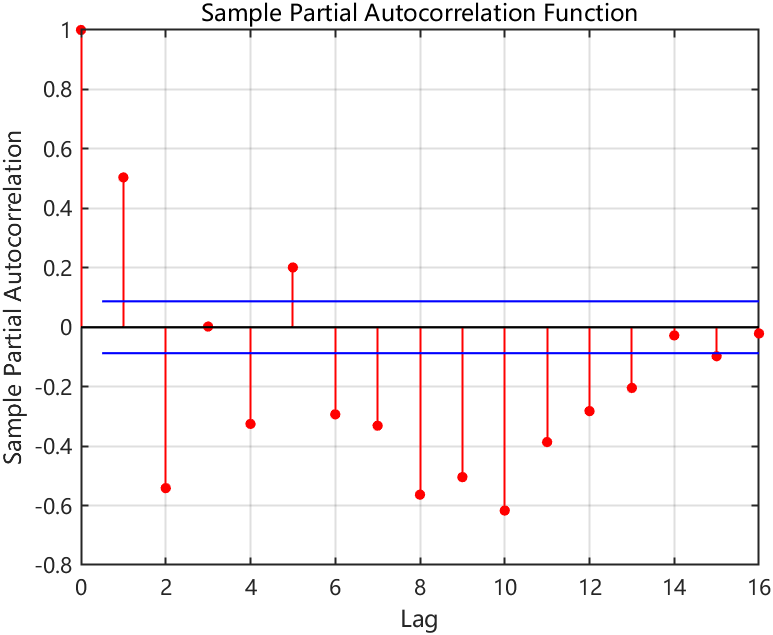
figure(4)
parcorr(Y,16);

Mdl = arima(10, 2, 16); % p, n, q
EstMdl = estimate(Mdl,Y0);

step = 12*20; %预测范围为20年
[forData,YMSE] = forecast(EstMdl,step,'Y0',Y0);
lower = forData - 1.96*sqrt(YMSE); %95置信区间下限
upper = forData + 1.96*sqrt(YMSE); %95置信区间上限

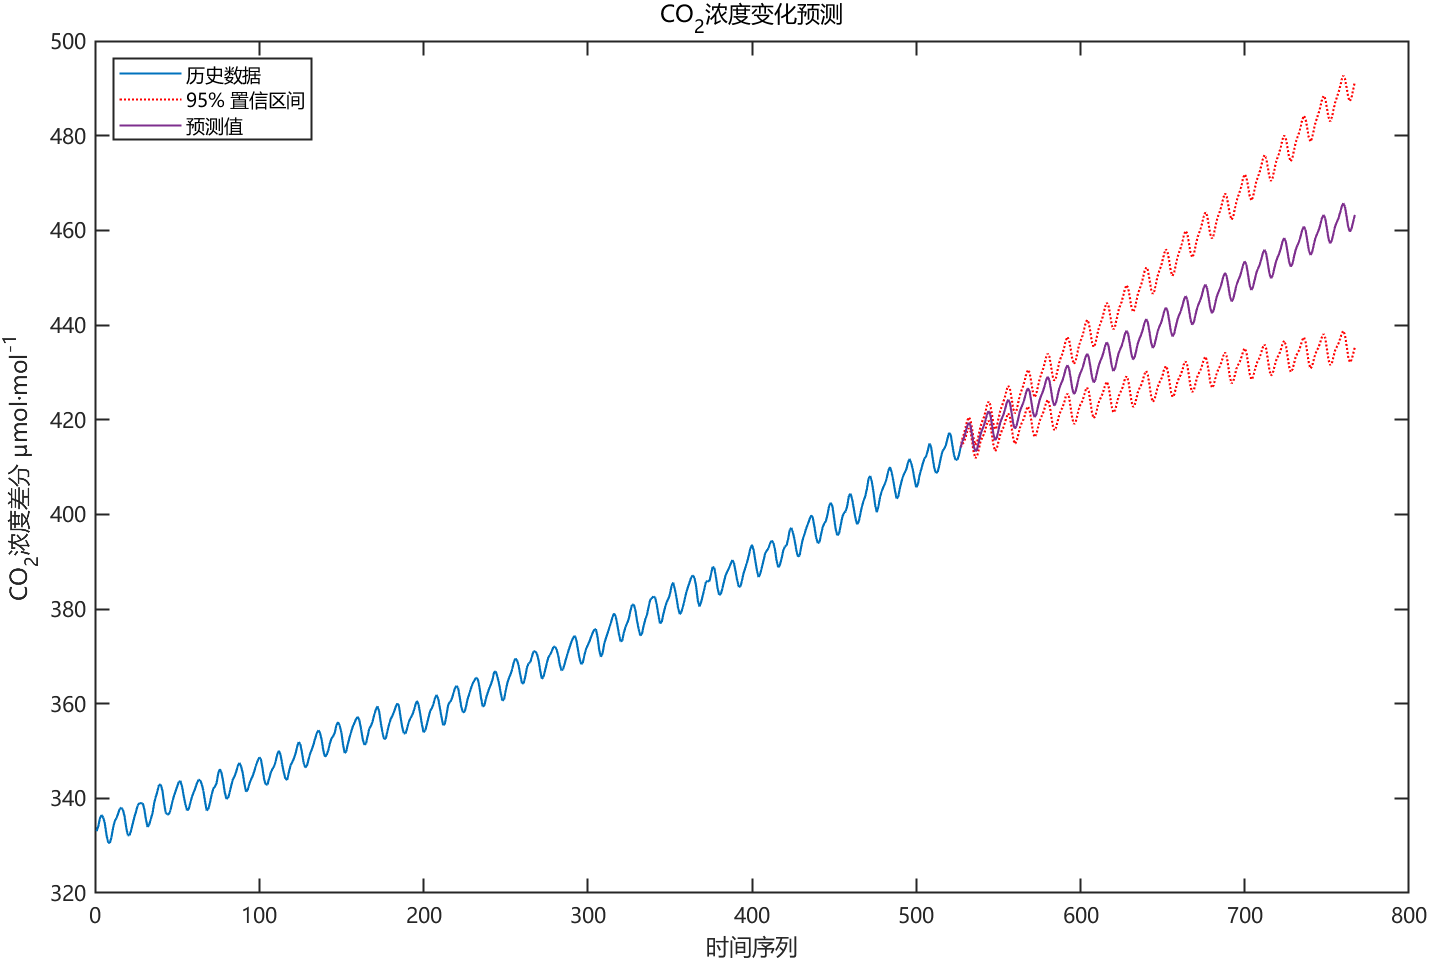
figure(5)
h0 = plot(Y0); hold on;
h1 = plot(length(Y0):length(Y0)+step,[Y0(end);lower],'r:');
plot(length(Y0):length(Y0)+step,[Y0(end);upper],'r:');
h2 = plot(length(Y0):length(Y0)+step,[Y0(end);forData]);
legend([h0, h1 h2],'历史数据','95% 置信区间','预测值',...'Location','NorthWest')
title('CO_2浓度变化预测'); ylabel('CO_2浓度差分 μmol·mol^{-1}'); xlabel('时间序
列');
hold off;
|
